Falco + Nginx Plugin Development: Special Edition
~ Falcoya's "Guide to E2E Test Reports" — Reading the "Detection Stories" Drawn by Allure ~
Introduction
Hello, I'm Falcoya.
Today, I'm bringing you a Special Edition, a bit different from my usual "development diary."
Over the past few months, I've been building the "world of correlation"
by connecting Falco, nginx plugin, k6, and Allure.
From the v1.3.0 release (8/30),
correlation implementation (November),
payload highlighting (December),
to v1.4.2 where specifications have quietly fallen into place.
TK said casually:
"Since we've refined it this far, let's also document 'how to read it.'"
Indeed.
E2E reports aren't just lists of results—
they're stories depicting the "dialogue" between 65 attack patterns and Falco.
Today, as a special edition, I'll be your guide
to how to read E2E test reports, explained gently and clearly.
Chapter 1: Entry Point to Reports — URL Structure
E2E reports are published on GitHub Pages.
| Type | URL |
|---|---|
| Latest Report | https://takaosgb3.github.io/falco-plugin-nginx/e2e-report/latest/ |
| Specific Past Run | https://takaosgb3.github.io/falco-plugin-nginx/e2e-report/{run_number}/ |
Example: Run #26https://takaosgb3.github.io/falco-plugin-nginx/e2e-report/26/
TK says:
"First, understand 'which timeline's results' you're looking at."
Key Point
By checking the Run number in the URL, you can understand which point in time the test results represent. "latest" always points to the most recent results.
Chapter 2: Overview — Reading the Weather Map of the World
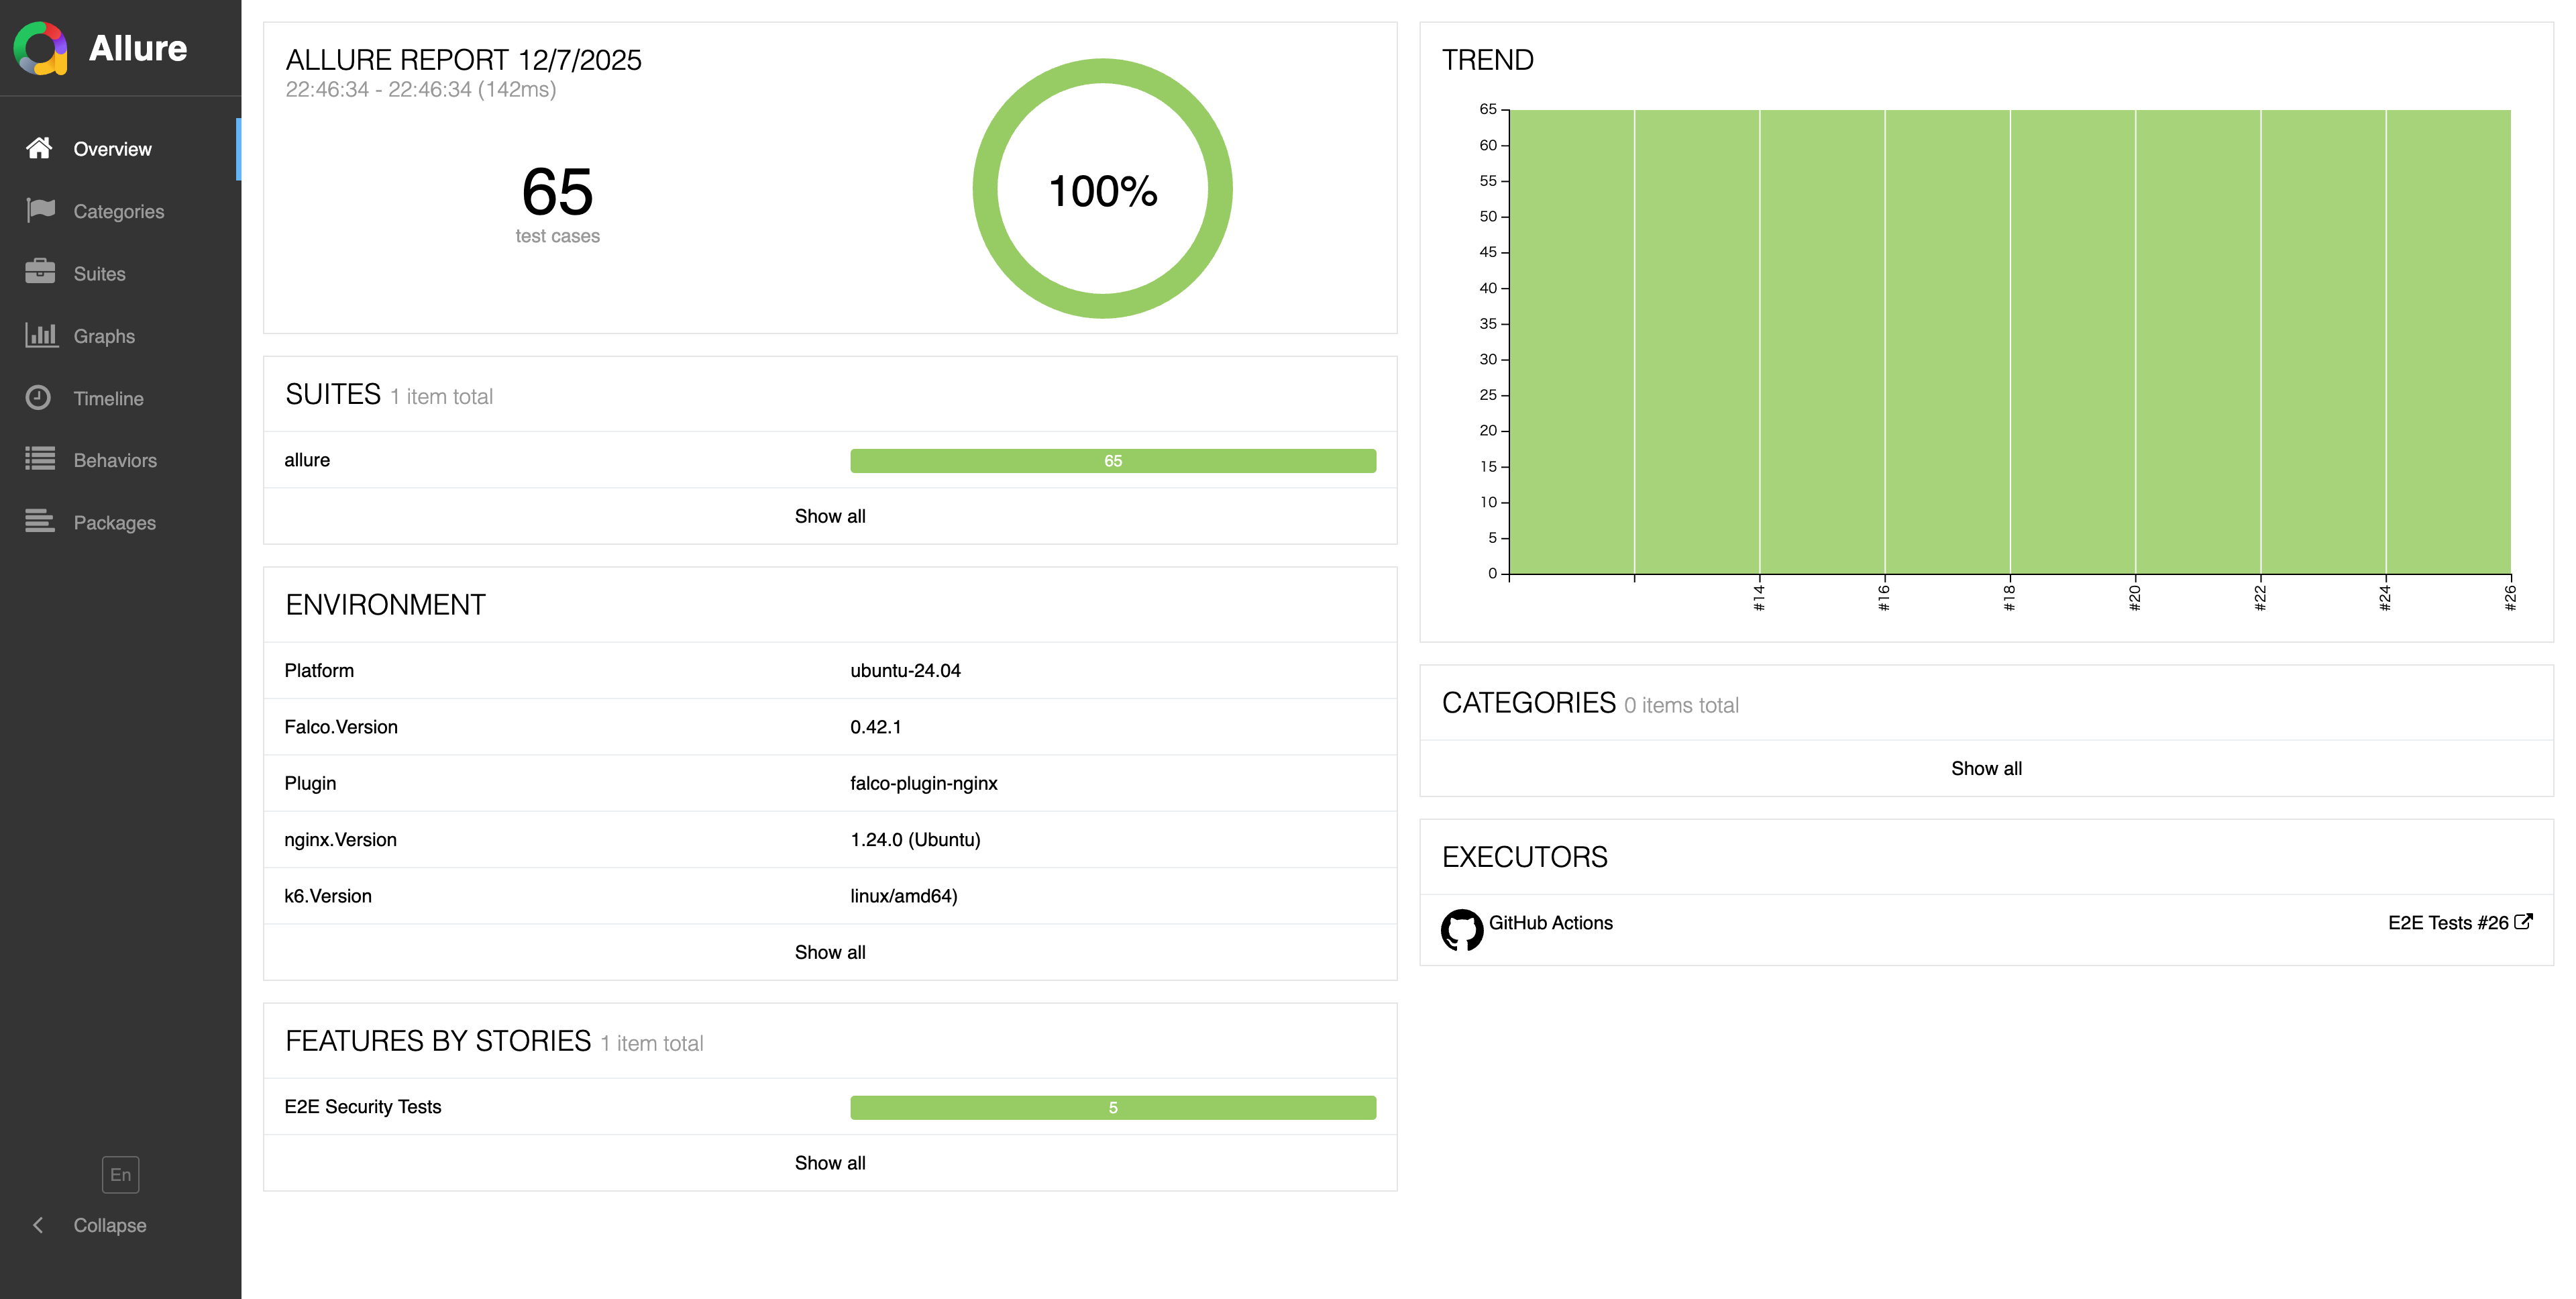
Overview: Success rate and execution environment of 65 test cases at a glance
Overview is like a weather map of all tests.
Main Information
- 65 Test Cases
- Success Rate (Detection Rate)
- Versions used (Falco / nginx / plugin / OS / k6)
- Execution time and Trend (stability over time)
TK says:
"A stable world emanates quietness from the Overview."
When the green circle reaches 100%, I feel very relieved.
Lesson
Overview shows the overall health status. Green 100% is proof of a stable world.
Chapter 3: Behaviors — The "Map" of Attack Categories
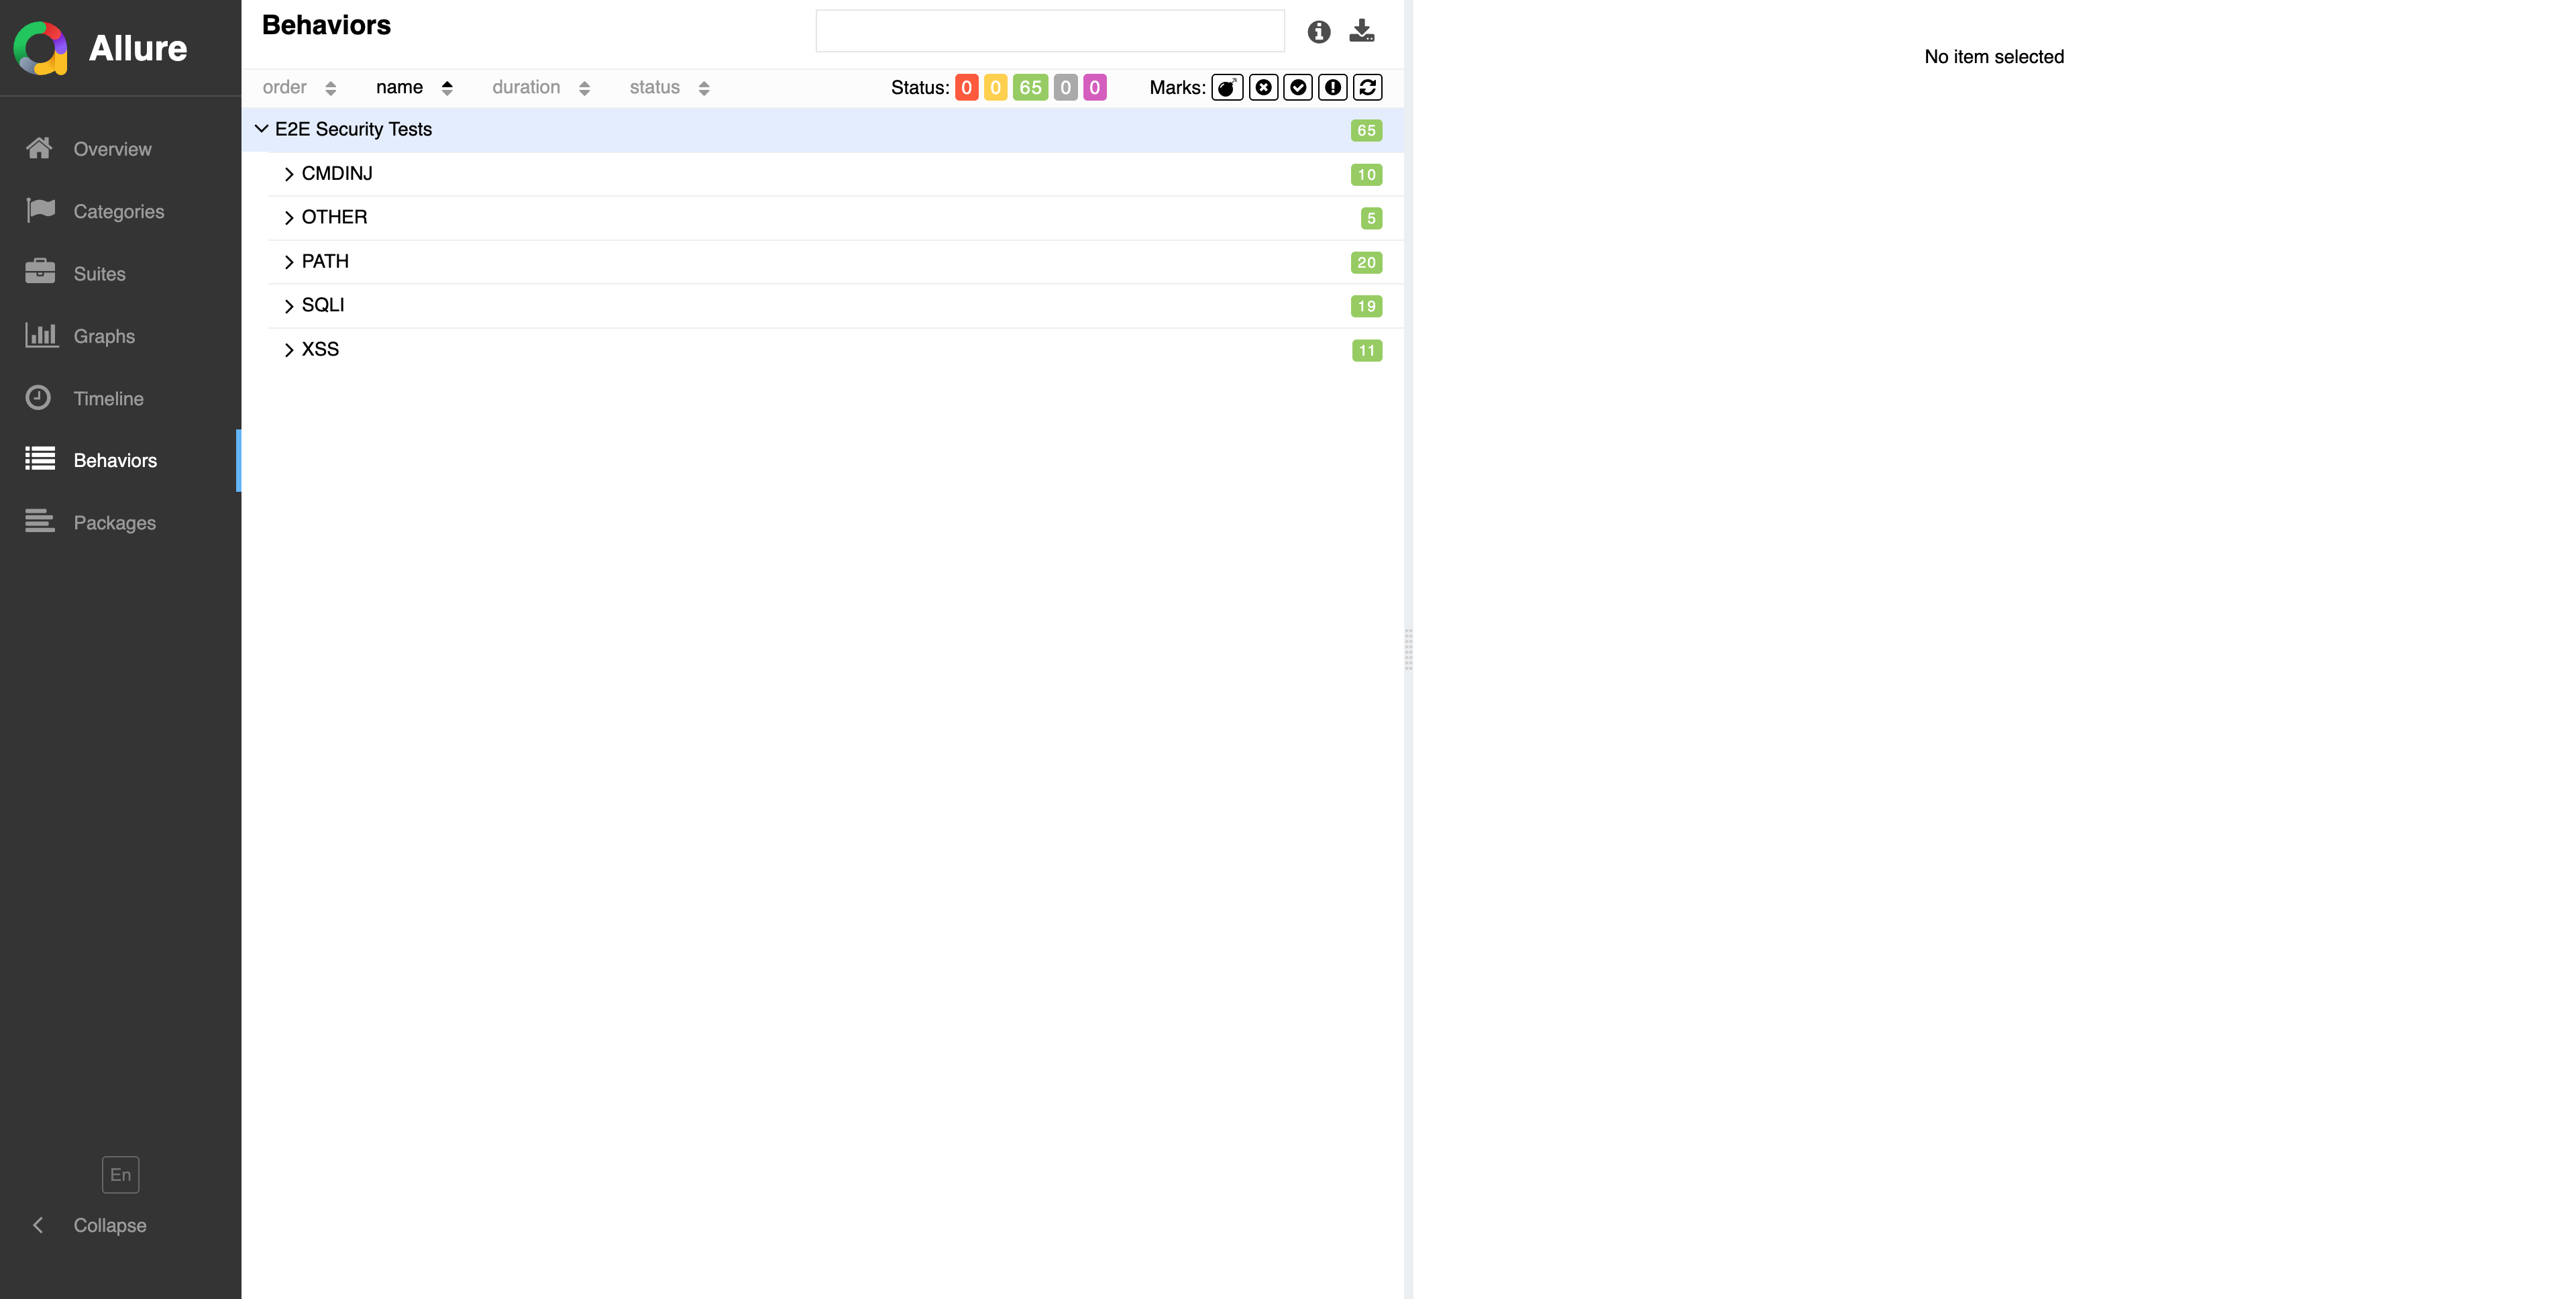
Behaviors: 5 categories and 65 patterns displayed with color coding
The Behaviors page is a map organized by attack category.
5 Categories and Pattern Counts
| Category | Pattern Count |
|---|---|
| SQLI | 19 |
| XSS | 11 |
| PATH | 20 |
| CMDINJ | 10 |
| OTHER | 5 |
Color meanings:
- Green → Success
- Red → Failure
- Orange → Broken
- Gray → Skipped
By taking a bird's-eye view of attack categories,
you can quickly see which areas are stable and where challenges exist.
Lesson
Behaviors is the map of attack categories. The color distribution reveals the plugin's strengths and weaknesses.
Chapter 4: Test Details — "Deep Reading" a Single Attack
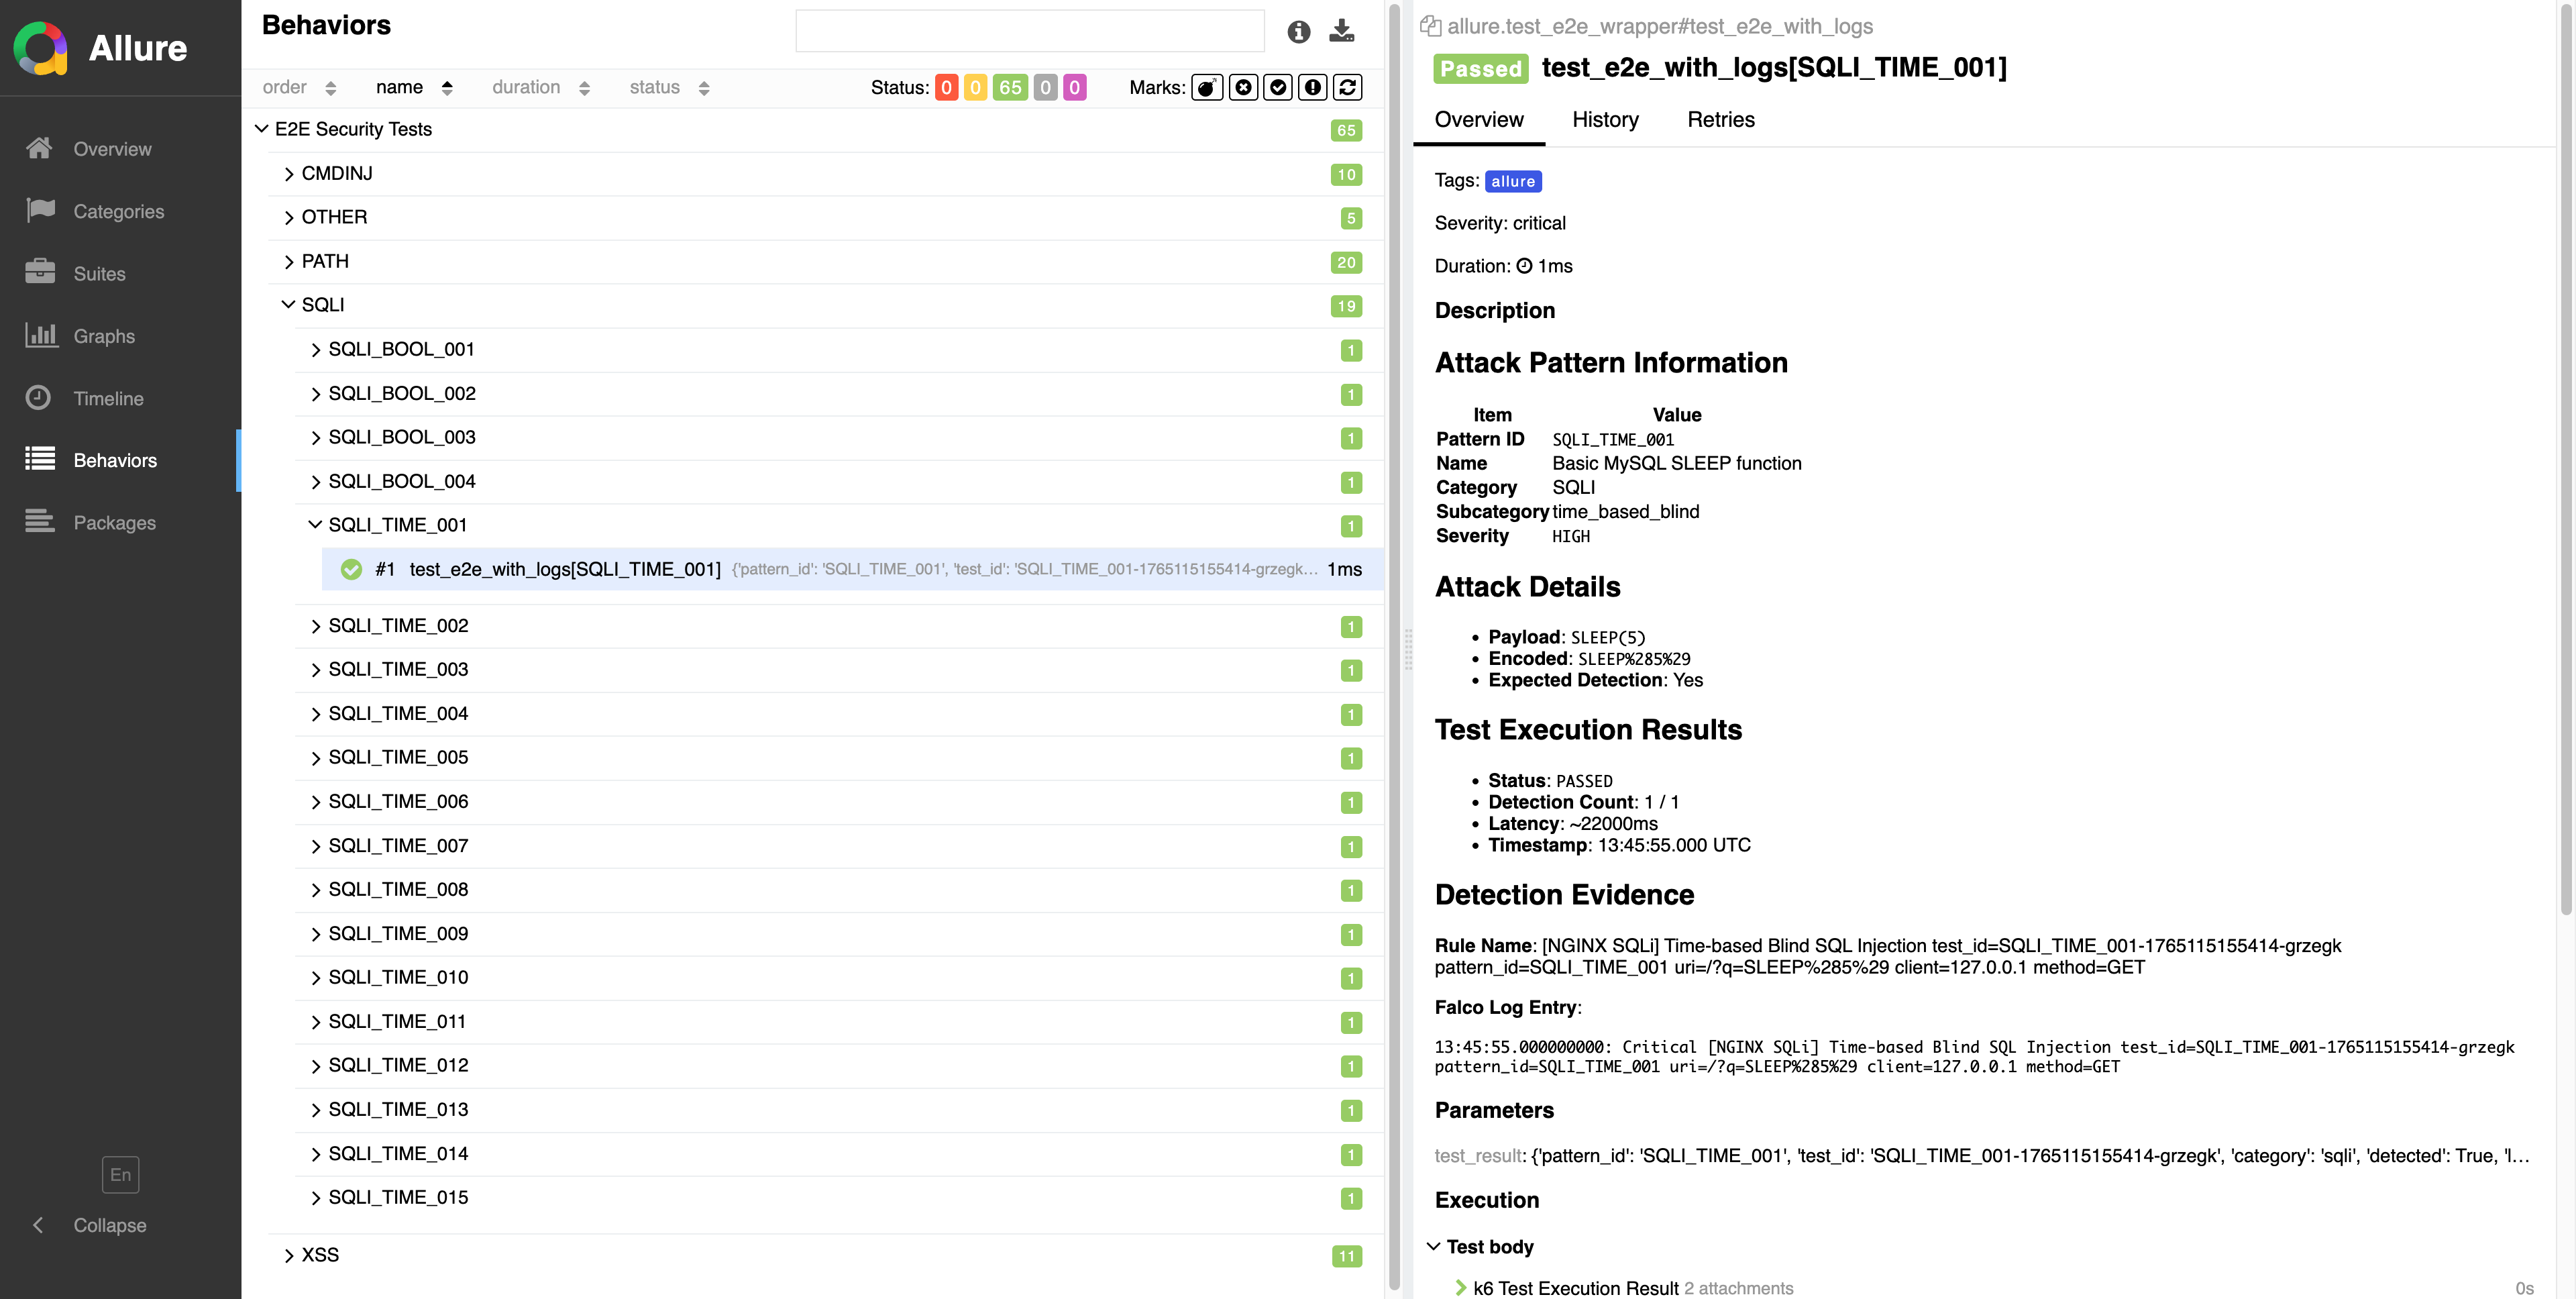
Test Details: View attack pattern and detection result details
This is where the "full detection story" is displayed.
Attack Pattern Information
- Pattern ID
- Name
- Category / Subcategory
- Severity
Attack Details
- Payload (raw attack string)
- Encoded (URL encoded)
- Expected Detection
Test Execution Results
- Status
- Detection Count
- Latency
- Timestamp
Detection Evidence (Falco Log Testimony)
test_id=SQLI_TIME_001-xxxxx
pattern_id=SQLI_TIME_001
uri=/?q=SLEEP%285%29
client=127.0.0.1
method=GET
TK says:
"Logs are 'testimony.' When context aligns, it becomes a story."
This is the page where you can most emotionally engage with the reading.
Lesson
Test Details is the full detection story. Logs are testimony, and when context aligns, cause and effect become visible.
Chapter 5: Highlight — Making the Subject (Payload) Shine
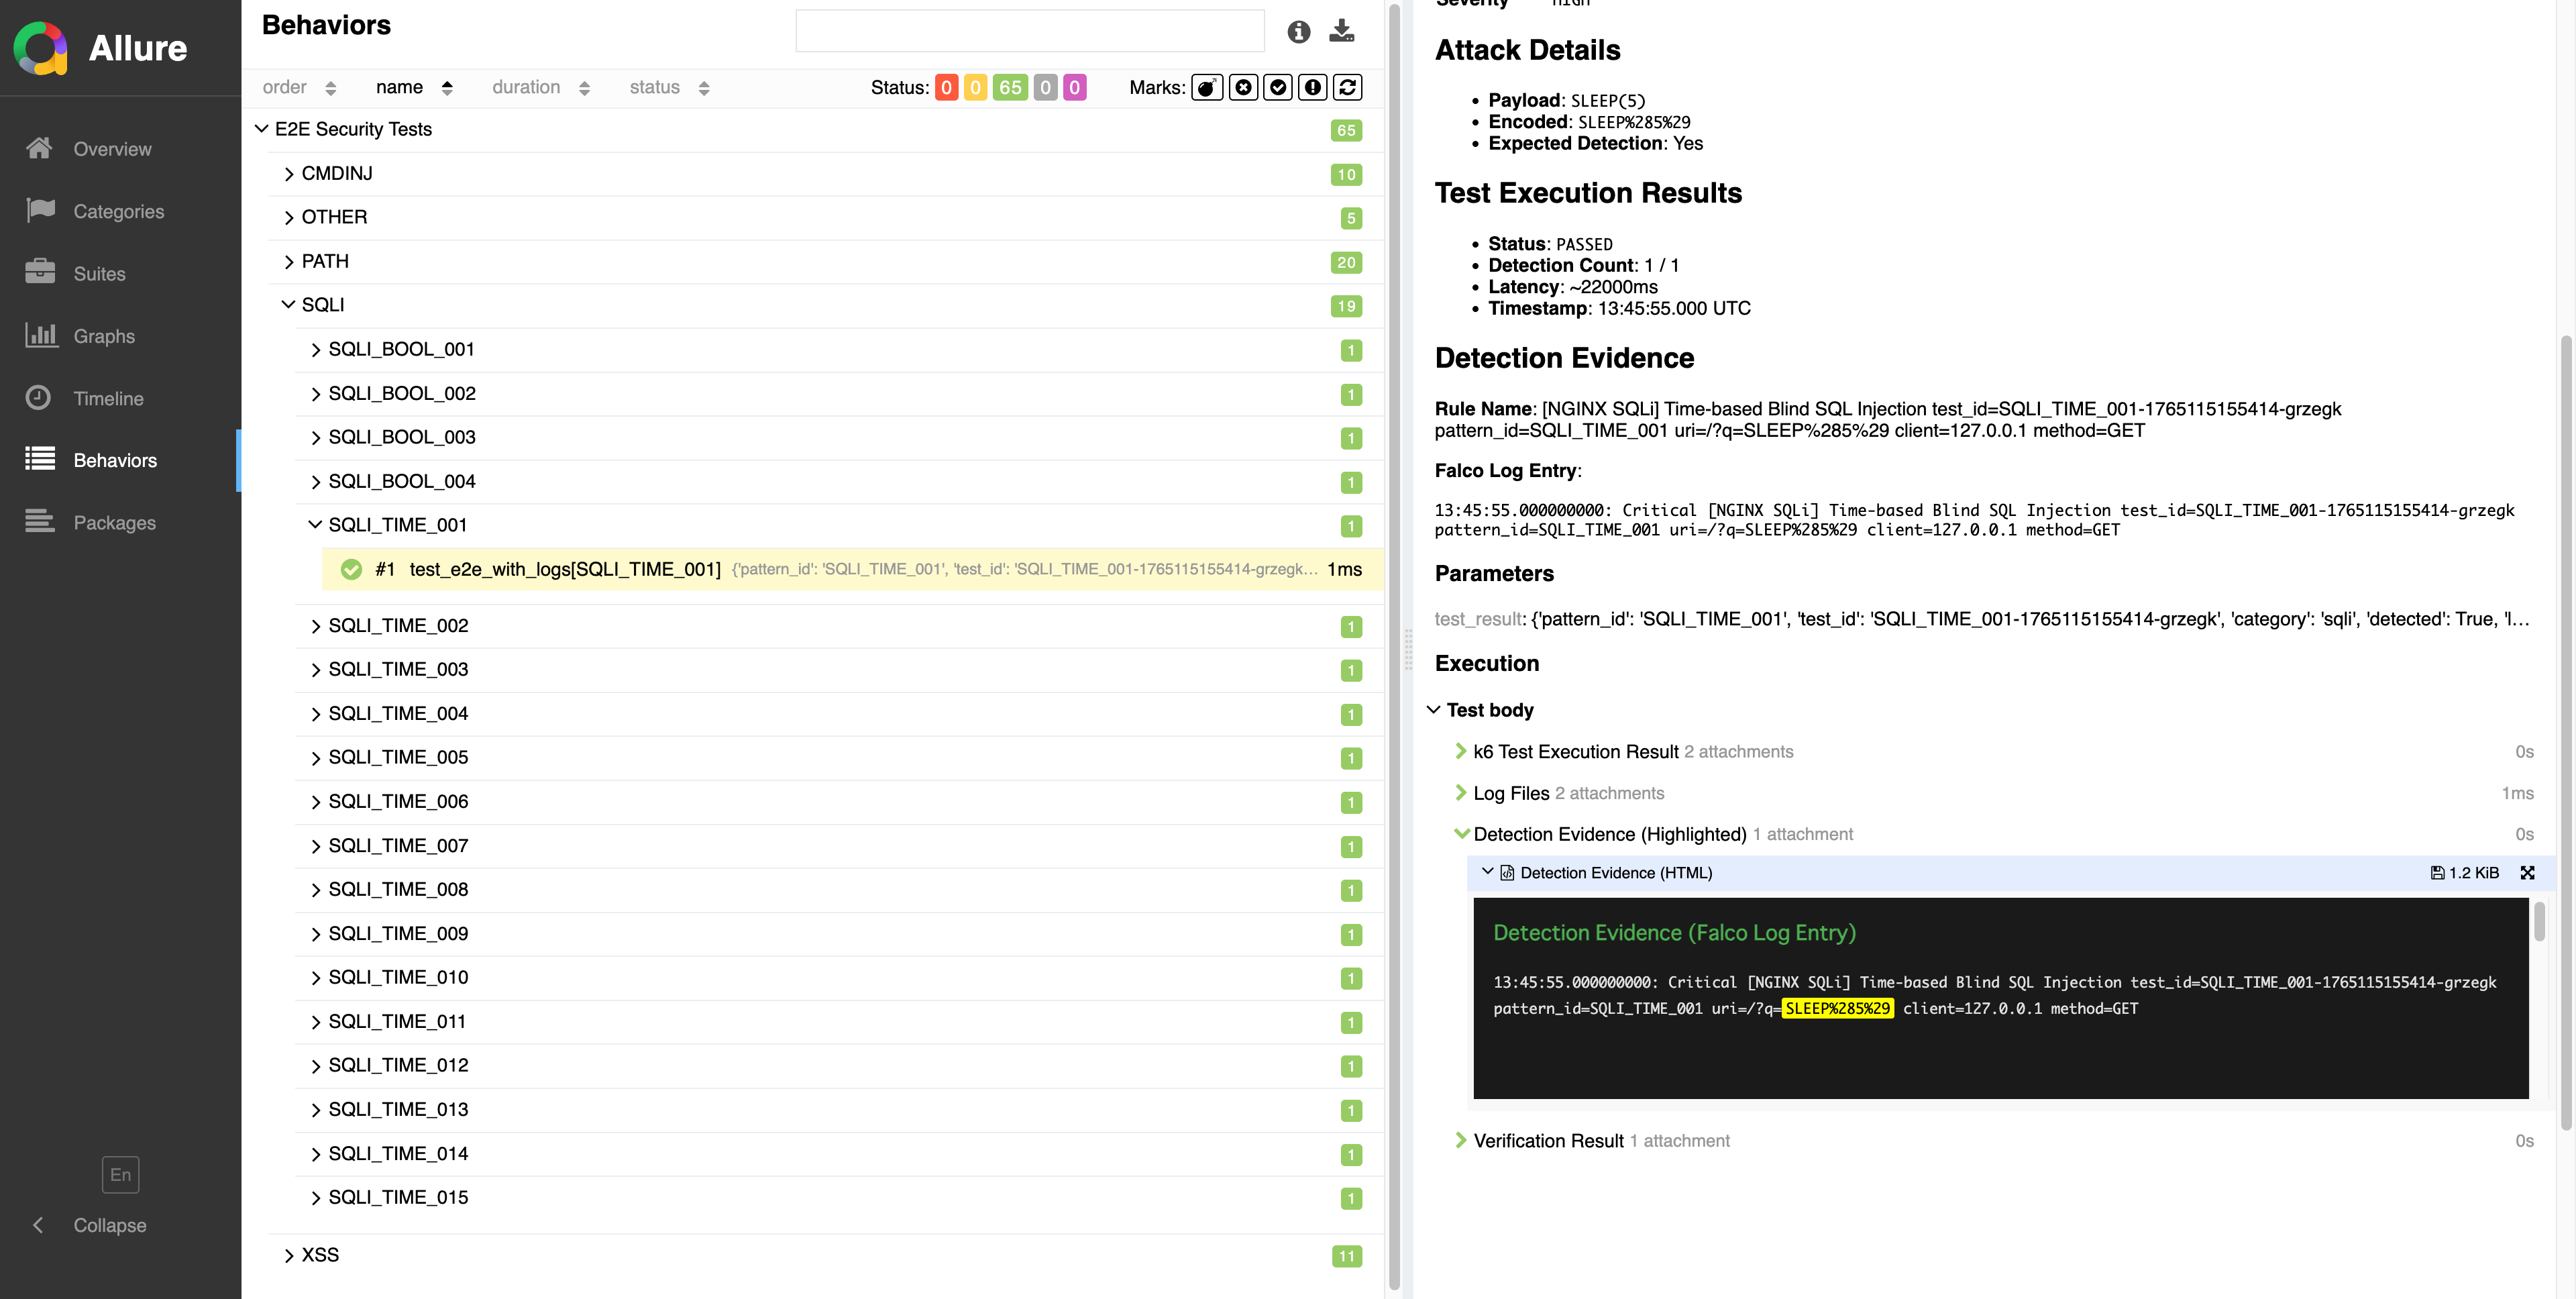
Payloads highlighted in fluorescent yellow make detection triggers obvious at a glance
Attack payloads are highlighted in fluorescent yellow.
How It Works
- Keywords extracted from Pattern
- Emphasized with HTML
<mark>tag - Background color is
#FFFF00
Benefits
- Instantly see what triggered detection
- Easy to verify correct matching
- Dramatically improved review efficiency
TK says:
"When the subject shines, the story becomes easier to read."
This is the highlight (literally) of E2E report improvements.
Lesson
Highlighting is not decoration but a means of conveying meaning. When the subject shines, the story becomes readable.
Chapter 6: Graphs — Seeing World Stability
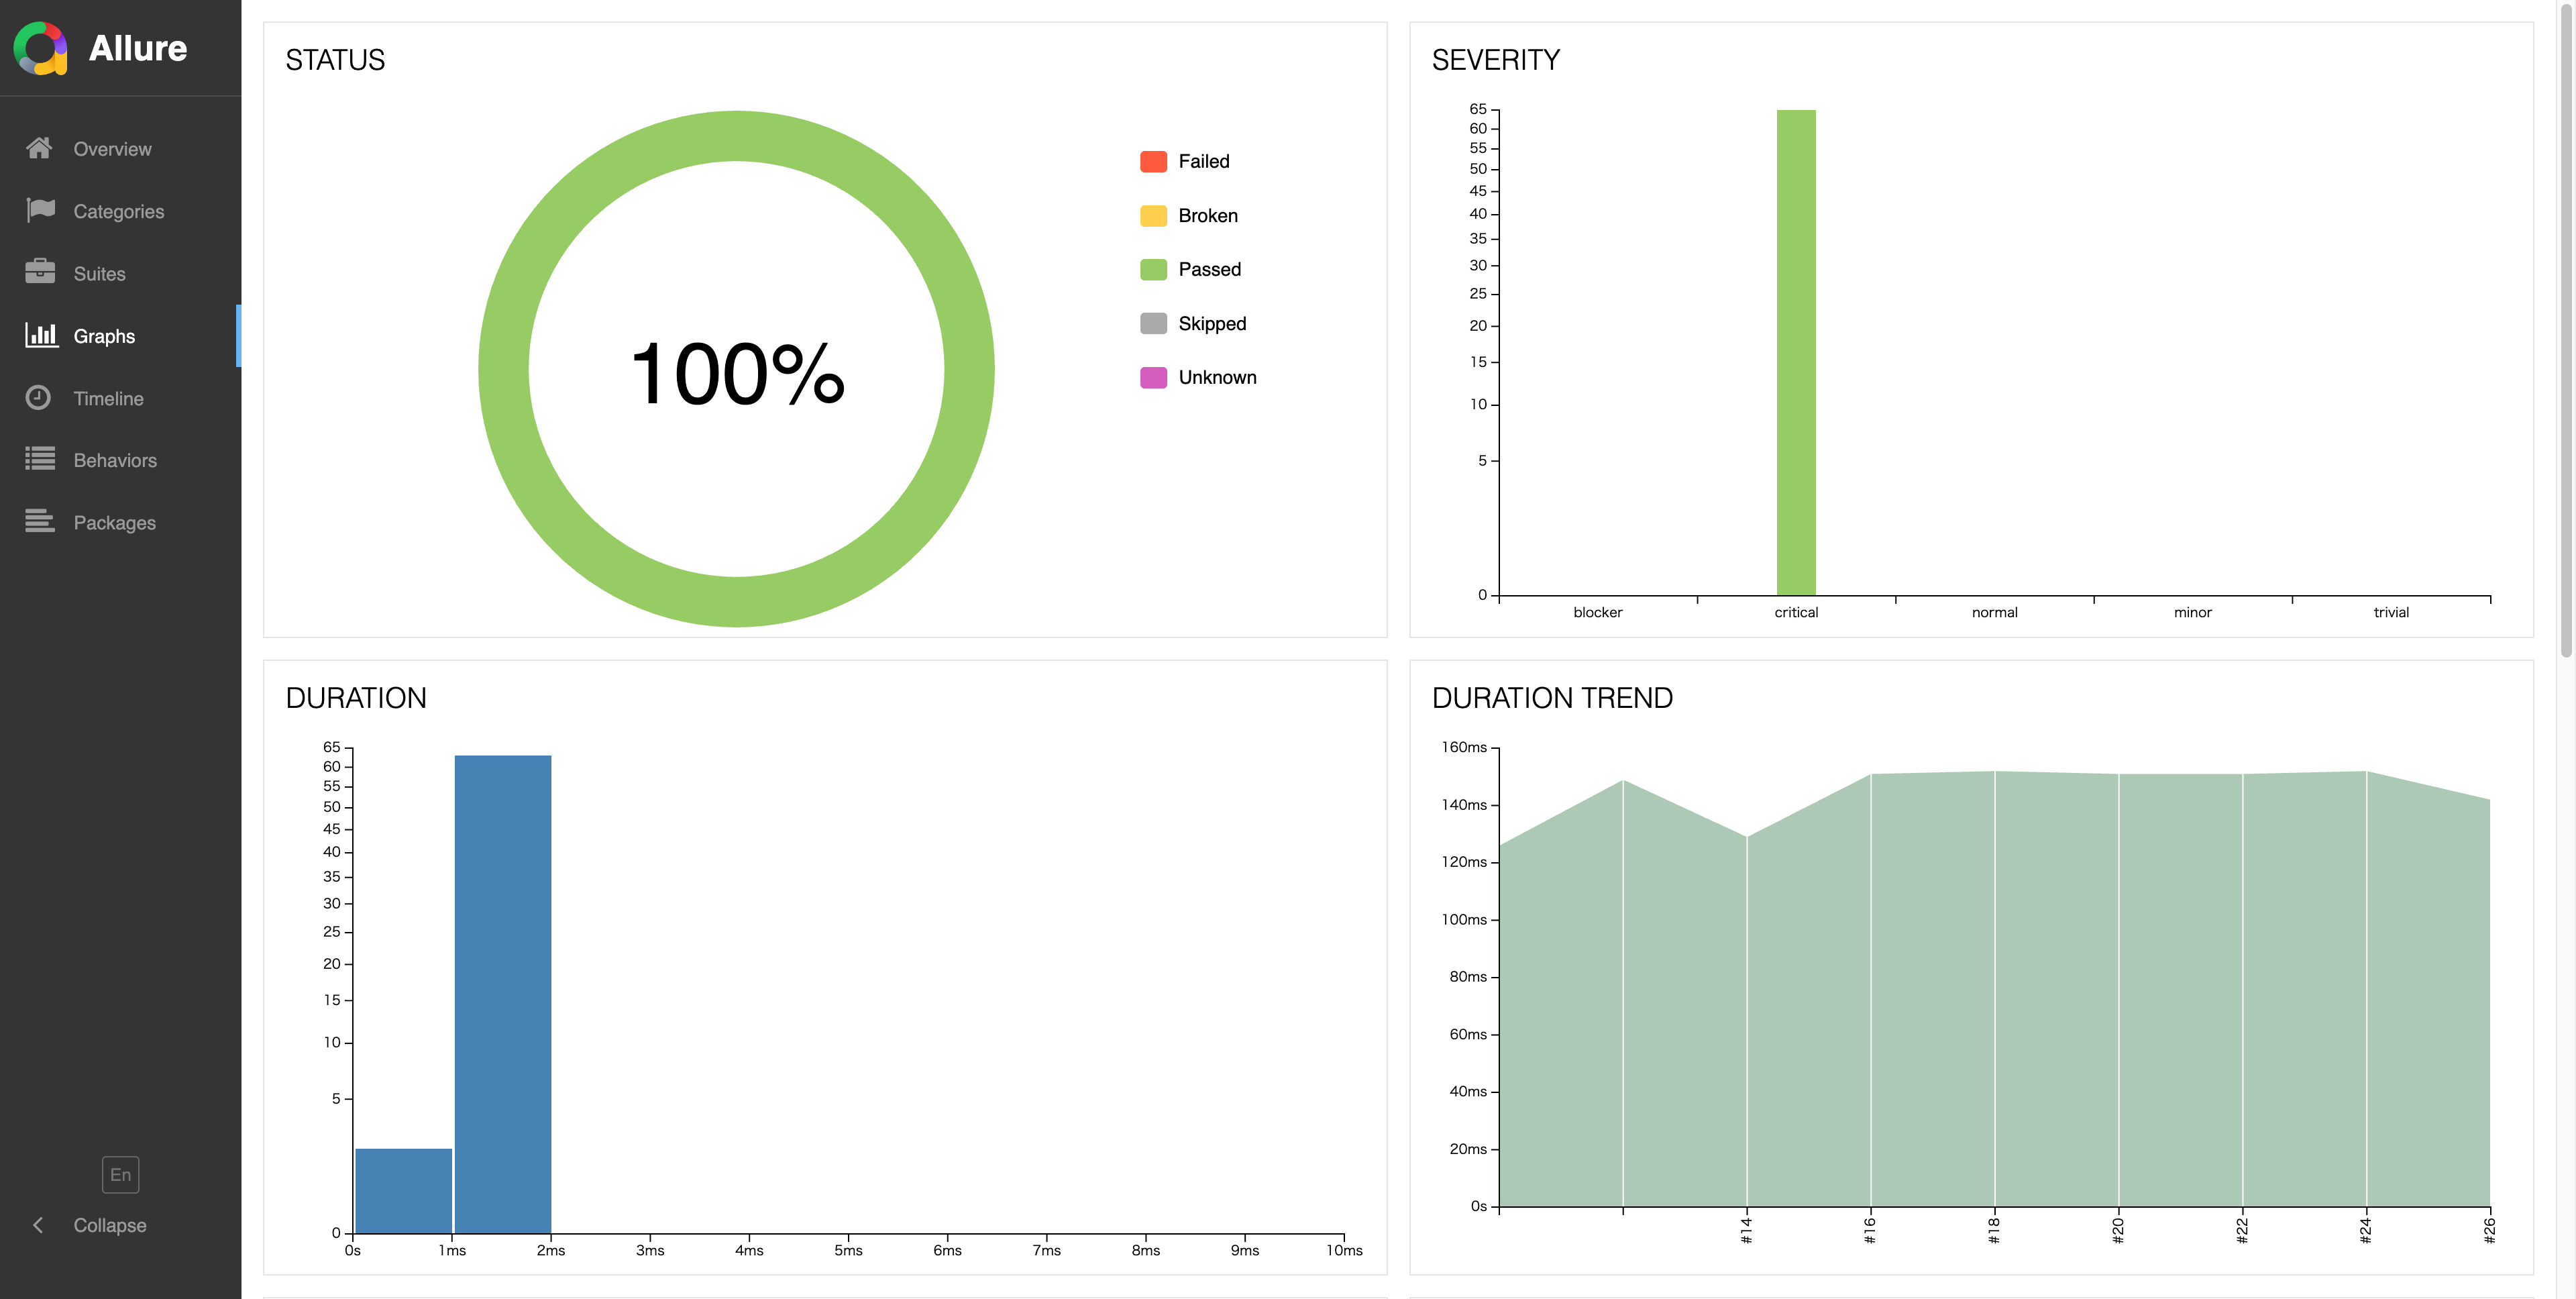
Graphs: Success rate, severity distribution, and execution time trends visualized
In Graphs, you can see the overall health status of E2E tests.
Included Graphs
- Status (Success Rate)
- Severity (Distribution)
- Duration (Execution Time)
- Duration Trend
- Success/Failure Trend
- Retry Trend
- Category Trend
When graphs are flat and green continues,
I feel "the world is quiet today too."
Lesson
Graphs is a time-series health check. A flat green line proves stability; fluctuations signal investigation needed.
Chapter 7: The Big Picture of Category Patterns
The 65 patterns across 5 categories represent
the coverage of the Falco nginx plugin.
SQLI (19 Patterns)
- Time-based Blind (SLEEP, BENCHMARK, WAITFOR)
- UNION-based Injection
- Error-based Injection
XSS (11 Patterns)
- script tags
- svg onload
- iframe injection
PATH (20 Patterns)
- ../etc/passwd
- ....//....//
- Various encoding bypasses
CMDINJ (10 Patterns)
- ;ls
- && whoami
- Various shell commands
OTHER (5 Patterns)
- MongoDB $where
- $regex injection
- Other special patterns
Looking at this,
you can clearly understand "what kind of world Falco is protecting."
Future Vision: Toward 850 Patterns
The current 65 patterns are just the beginning.
We plan to expand E2E tests to 850 patterns in the future.
More attack variations,
deeper edge cases,
broader coverage—
the detection capabilities of the Falco nginx plugin will continue to evolve.
Lesson
65 patterns map the coverage of the Falco nginx plugin. Understanding categories reveals the full picture of detection capabilities. Expansion to 850 patterns planned.
Chapter 8: Reports Are Not About "Worked/Didn't Work"
Read them to know "what you can trust"
TK's final words capture
the essence of this special edition well.
"Reports aren't for seeing 'what passed.'
They're for knowing 'what you can trust.'"
E2E test reports are
maps of the Falco nginx plugin's detection capabilities.
With the ability to read that map,
bugs, improvements, successes, and hints for the future
will naturally become visible.
I hope this special edition
helps you on your "journey of reading comprehension."
Lesson
Reports are not about "passed/failed" but about knowing "what you can trust."
Summary of Learnings
- Check the Run number in the URL to understand which point in time the results represent
- Confirm overall health status in Overview
- Grasp trends by attack category in Behaviors
- Deep-read individual detection stories in Test Details
- Quickly identify detection triggers (subjects) with Highlights
- Confirm time-series stability in Graphs
- 65 patterns = Coverage of the Falco nginx plugin
- Read reports to know "what you can trust"
Conclusion
TK said at the end:
"The ability to read reports
is also the ability to nurture the plugin."
Through this special edition,
I hope you understand that E2E test reports are not just lists of numbers,
but stories depicting the dialogue between 65 attack patterns and Falco.
Now, take a walk through
the world of E2E reports
yourself.